
The TEXT function adds a text annotation to the current IDL Graphic.
The following lines create the plot shown here.
x = 0.01*(FINDGEN(201))
p1 = PLOT(x, EXPINT(1, x), '2', YRANGE=[0,2])
p2 = PLOT(x, EXPINT(2, x), 'r2', /OVERPLOT)
p3 = PLOT(x, EXPINT(3, x), 'g2', /OVERPLOT)
t1 = TEXT(0.3, 1.6, $
'$\it E_n(z) = \int_{1}^{\infty} ' + $
'e^{-zt} t^{-n} dt, \Re(z)\geq 0$', $
/DATA, FONT_SIZE=14, FONT_NAME='Helvetica')
t2 = TEXT([0.4, 0.22, 0.1], [0.8, 0.55, 0.2], $
'$\it n = '+['1','2','3']+'$', /DATA)
See Annotations Examples for additional examples using the TEXT function.
text = TEXT(X, Y, [Z,] String [, Format] [, Keywords=value][, Properties=variable])
Keywords are applied only during the initial creation of the graphic.
[, /DATA] [, /DEVICE] [, /NORMAL] [, /RELATIVE] [, TARGET=variable]
Properties can be set as keywords to the function during creation, or retrieved or changed using the "." notation after creation.
ALIGNMENT, BASELINE, CLIP, COLOR, FILL_BACKGROUND, FILL_COLOR, FONT_COLOR, FONT_NAME, FONT_SIZE, FONT_STYLE, HIDE, NAME, ORIENTATION, STRING, TRANSPARENCY, UPDIR, UVALUE, VERTICAL_ALIGNMENT, WINDOW
Note: The Rotate method only applies to text objects that are within the annotation layer, not the dataspace. For text objects in the dataspace, use the ORIENTATION property to rotate the text. Also, the Scale method is not available for text objects. To scale the text, use the FONT_SIZE property.
The TEXT function returns a reference to the created text annotation. Use the returned reference to manipulate the annotation after creation by changing properties or calling methods.
The location where the text will be placed, in data, normal, or device coordinates.
The text to be displayed. If the string is an array, each item displays on a separate line. You can add mathematical symbols and greek letters using a TeX-like syntax. For details see Adding Mathematical Symbols and Greek Letters to the Text String.
A string that sets the text color using short tokens. For example, to create red text, you would use the following:
t = TEXT(0.5, 0.5, 'Hello', 'r')
Keywords are applied only during the initial creation of the graphic.
Set this keyword if the input arguments are specified in data coordinates. Setting this keyword inserts the text into the current data space, otherwise the text is added to the annotation layer.
Set this keyword if the input arguments are specified in device coordinates (pixels).
Set this keyword if the input arguments are specified in normalized ( [0, 1] ) coordinates (the default).
Set this keyword to indicate that the input arguments are specified in normalized [0,1] coordinates, relative to the axis range of the TARGET's dataspace. If the TARGET keyword is not specified, then setting /RELATIVE is the same as setting /NORMAL.
Note: When using /RELATIVE, even though the coordinates are relative to the TARGET's dataspace, the graphic is added to the annotation layer, not to the dataspace.
Set this keyword to the graphic object to use if points are specified in data coordinates.
A floating-point value between 0.0 and 1.0 that indicates the horizontal alignment of the text baseline. An alignment of 0.0 (the default) left-justifies the text at the given position; an alignment of 1.0 right-justifies the text, and an alignment of 0.5 centers the text.
A two- or three-element floating-point vector that sets the direction in which the baseline is to be oriented. Use this property in conjunction with UPDIR to specify the plane on which the text lies.
The following table gives the commonly-used BASELINE values:
|
Vector |
Description |
|---|---|
|
[1.0, 0, 0] |
Parallel to +X axis (default) |
|
[0, 1.0, 0] |
Parallel to +Y axis |
|
[0, 0, 1.0] |
Parallel to +Z axis |
Set this property to 1 to clip portions of the text that lie outside of the dataspace range, or to 0 to disable clipping. The default is 1. This property is ignored unless the DATA property is set.
Set this property to a string or RGB vector that specifies the text color. The default is "black".
A value of 1 fills the area inside the text box.
Set this property to a string or RGB vector that specifies the fill color inside the text box.
Set this property to a string or RGB vector that specifies the text color. The default value is "black".
A string specifying the name of the IDL or system font to use for the text string. The default value is "Helvetica". The following font names are available on all systems:
On Windows platforms, you may also use any other fonts installed on your system.
Set this property to an integer or floating-point value giving the font size in points. The default is 16.
An integer or string specifying the font style to be used for the text string. Allowed values are:
|
Integer |
String |
Resulting Style |
|
0 |
"Normal" or "rm" |
Default (roman) |
|
1 |
"Bold" or "bf" |
Bold |
|
2 |
"Italic" or "it" |
Italic |
|
3 |
"Bold italic" or "bi" |
Bold italic |
Set this property to 1 to hide the graphic. Set HIDE to 0 to show the graphic.
A string that specifies the name of the graphic. The name can be used to retrieve the graphic using the brackets array notation. If NAME is not set then a default name is chosen based on the graphic type.
Set this property to the angle of the text annotation. The angle rotates counterclockwise from the positive x axis. If not supplied, the default value 0 is used.
After the text annotation is created, set this property to a string or an array of strings to change the displayed text. If STRING is an array then each string will be placed on a separate line.
An integer between 0 and 100 that specifies the percent transparency of the text. The default value is 0.
A two- or three-element floating-point vector describing the vertical direction for the string. The upward direction is the direction defined by a vector pointing from the origin to the point specified.
Use this property in conjunction with BASELINE to specify the plane on which the text lies (the direction specified by UPDIR should be orthogonal to the direction specified by BASELINE).
For example, if you wanted a string to lie in the Y-Z plane, pointing downwards and towards you, you would define BASELINE to be [0, 0, 1.0] (the +Z direction), and UPDIR to be [0, -1.0, 0] (the -Y direction).
Set this property to an IDL variable of any data type.
A floating-point value between 0.0 and 1.0 that indicates the vertical alignment of the text baseline. An alignment of 0.0 (the default) bottom-justifies the text at the given position; an alignment of 1.0 top-justifies the text.
This property retrieves a reference to the WINDOW object which contains the graphic.
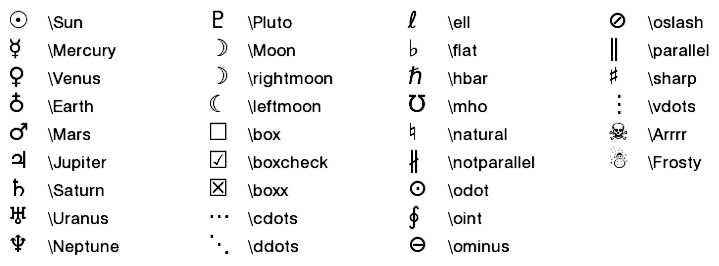
You can add mathematical symbols and Greek letters to the text string using a TeX-like syntax. To turn on math symbols for a text string (or a portion of a string), you need to surround that region with a pair of "$" characters. The following tables list the symbols and letters you can embed within a text string:
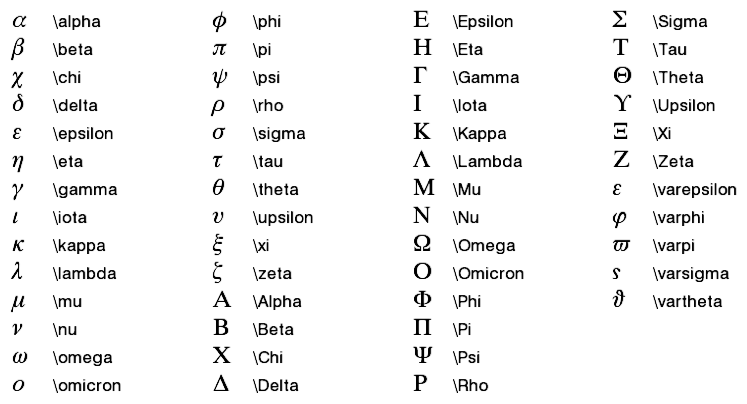

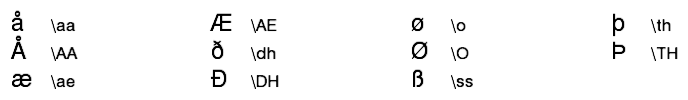
Note: The following symbols are generated using Unicode characters from the DejaVuSans font. These characters will display correctly on the screen and when the graphics are saved to a bitmap file. However, because IDL's postscript and PDF drivers do not support Unicode, these characters will not display properly when the graphics are saved to a vector postscript or vector PDF file. If you want to use these characters with postscript or PDF, you should specify the /BITMAP keyword with the Save Method method.
Within the $ ... $ sections, use an underscore ( _ ) character to create a subscript, and a caret ( ^ ) to create a superscript. If the underscore or caret is followed by a single character, only that character will be subscripted or superscripted. Optionally, you can use curly braces { } to subscript or superscript an entire group of characters. You can also nest superscripts and subscripts (two levels only).
For example:
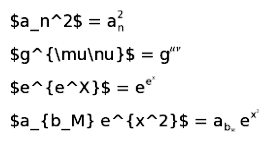
Use the following commands to change fonts within the $ ... $ sections of the string:
|
Font Command |
Description |
|---|---|
|
\bf |
Helvetica bold |
|
\it |
Helvetica italic |
|
\bi |
Helvetica bold italic |
|
\rm |
Default font |
You can also use "\U(u0, u1,...,un)" to insert arbitrary Unicode characters from the DejaVuSans font included in the IDL distribution. Each ui within the parentheses will be interpreted as a 16-bit hexadecimal Unicode value. For example:
w = WINDOW()
t = TEXT(0.5, 0.5, $
"$\U(266A,266C) \Pluto's really small \U(266B)$")

The SHOWFONT procedure may be used to display the Unicode characters from the DejaVuSans font.
Note: To include Unicode characters from a font other than DejaVuSans, you should use the FONT_NAME property to change the font, and then use the "!Z" embedded formatting command instead of "\U".
"\$"."$A\times B$", the resulting string is "AxB", with no space. Any additional spaces following the symbol will be included in the output."\ " (backslash+space)."\sqrt" square root symbol is wide enough to accommodate one character underneath the root. You can use curly braces { } to include a group of characters. For example, you could do "$\sqrt{b^2 - 4ac}$"."$A_{ijk}^{2}B$"
You should compose the string this way:
"$A^{2}_{ijk}B$"
"\\", "\{", "\}", "\^", "\_"
| 8.0 | Introduced |
| 8.1 |
Added the UVALUE property and the Delete method. |
| 8.2 | Added \dagger, \ddagger, \emptyset, \permil, \primeprime, and the Unicode symbols, including the planets. Added Unicode \U support. Added \sqrt{ } support. |
PLOT, POLYGON, POLYLINE, Using IDL Graphics, Using TrueType Fonts
TEXT TEXT TEXT TEXT TEXT TEXT TEXT TEXT TEXT TEXT TEXT TEXT TEXT TEXT TEXT TEXT TEXT TEXT TEXT TEXT TEXT TEXT TEXT TEXT TEXT TEXT TEXT TEXT TEXT TEXT TEXT TEXT TEXT TEXT TEXT TEXT TEXT TEXT TEXT TEXT TEXT TEXT TEXT TEXT TEXT TEXT TEXT TEXT TEXT TEXT TEXT TEXT TEXT TEXT TEXT TEXT TEXT TEXT TEXT TEXT TEXT TEXT TEXT TEXT TEXT TEXT TEXT TEXT TEXT TEXT TEXT TEXT TEXT TEXT TEXT TEXT TEXT TEXT TEXT TEXT TEXT TEXT TEXT TEXT TEXT TEXT TEXT TEXT TEXT TEXT TEXT TEXT TEXT TEXT TEXT TEXT TEXT TEXT TEXT TEXT TEXT TEXT TEXT TEXT TEXT TEXT TEXT TEXT TEXT TEXT TEXT TEXT TEXT TEXT TEXT TEXT TEXT TEXT TEXT TEXT TEXT TEXT TEXT TEXT TEXT TEXT TEXT TEXT TEXT TEXT TEXT TEXT TEXT TEXT TEXT TEXT TEXT TEXT TEXT TEXT TEXT TEXT TEXT TEXT TEXT TEXT TEXT TEXT TEXT TEXT TEXT TEXT TEXT TEXT TEXT TEXT TEXT TEXT TEXT TEXT TEXT TEXT TEXT TEXT TEXT TEXT TEXT TEXT TEXT TEXT TEXT TEXT TEXT TEXT TEXT TEXT TEXT TEXT TEXT TEXT TEXT TEXT TEXT TEXT TEXT TEXT TEXT TEXT TEXT TEXT TEXT TEXT TEXT TEXT TEXT TEXT TEXT TEXT TEXT TEXT TEXT TEXT TEXT